Dave Vu

Data analyst for insurance and actuarial teams, based in Perth.

I take public insurance data from raw files to tested pipelines, dashboards and written findings. I'm completing a Master of Computing at Curtin University and studying for the IFoA CS1 Actuarial Statistics exam.

QLD 172% 30% WA 51% 67% 100%: claims equal premium
Same peril, opposite seasons. Queensland home insurance losses peak with summer storms; Western Australia's peak with winter cold fronts. Loss ratios for the Householders class, Dec 2023 to Jun 2026, from my APRA dashboard.

Projects

Two end-to-end analyses of Australian insurance data. Each repository includes the pipeline code, automated data checks and a README with the full method.

Australian Natural Catastrophe Insurance Loss Analysis

Are natural catastrophes getting more expensive, or are there just more insured homes in harm's way?

  • Reported losses rose about 50-fold since the 1970s, but only 27% once adjusted for prices and exposure growth.
  • Hail is the costliest peril: one in three major hailstorms caused over $1bn in losses.
  • The choice of tail model moves the return period of a $5bn event from 1-in-4 to 1-in-24 years; a truncated lognormal fits the record best.

743 events from 1967 to 2026. Built with Python, SQLite, statsmodels and SciPy, using Poisson regression and maximum likelihood.
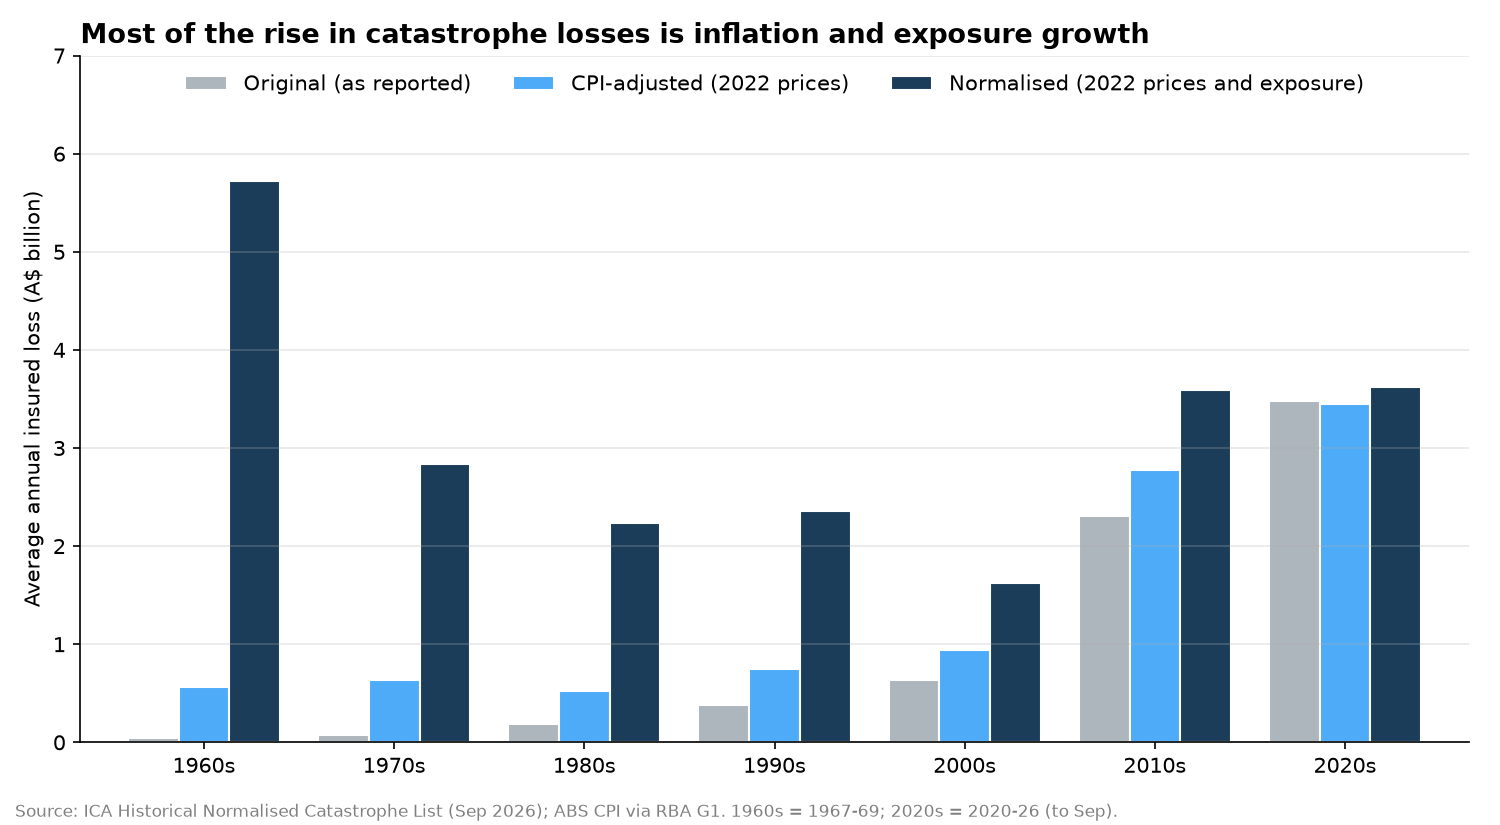
Bar chart of average annual insured catastrophe loss by decade, comparing original, CPI-adjusted and normalised losses. Original losses rise steeply; normalised losses stay between about 1.6 and 3.6 billion dollars a year after the 1960s.
Average annual loss by decade: most of the rise is inflation and exposure growth.

Australian General Insurance Performance Dashboard

Which classes of business make an underwriting profit, and when do catastrophes push them into loss?

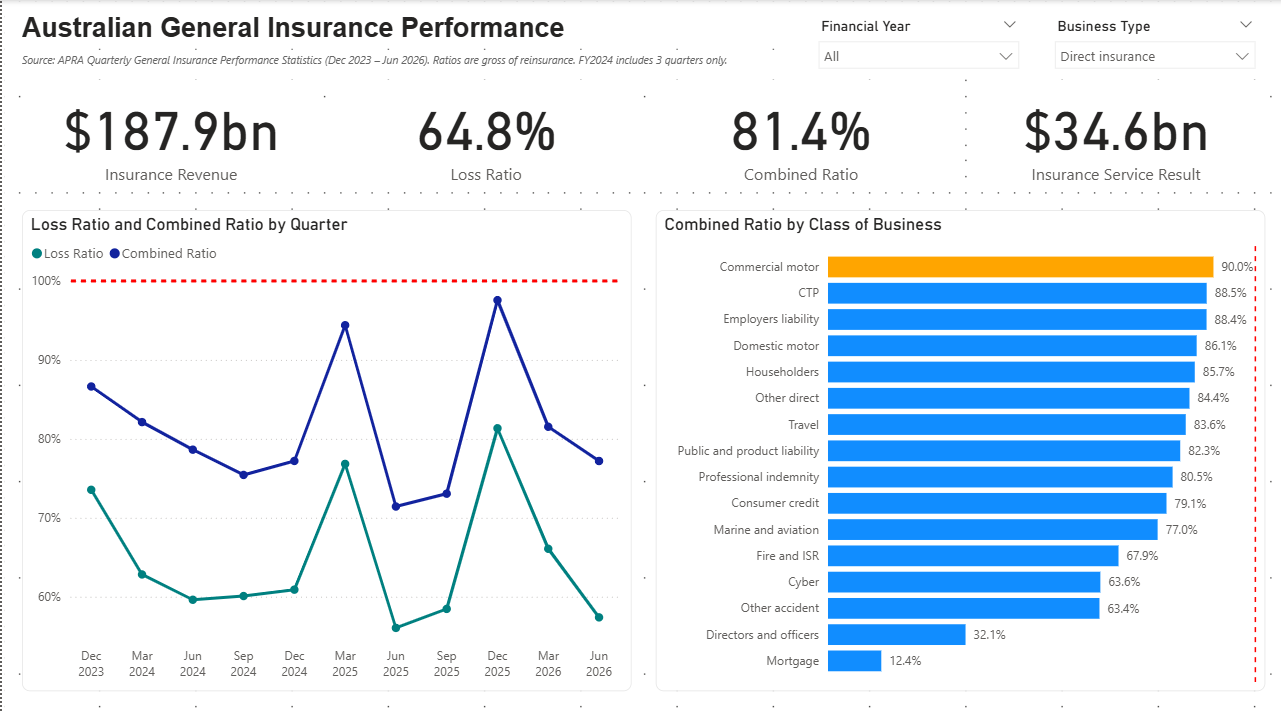
  • Python pipeline turning 29,455 rows of APRA statistics into a SQLite star schema, reconciled against 187 published subtotals.
  • Three-page Power BI dashboard of loss and combined ratios across 18 classes, 8 states and 11 quarters.
  • Found and fixed a bias from masked data that understated the industry combined ratio (80.5% corrected to 81.4%).

APRA quarterly statistics on the AASB 17 basis. Built with Python, SQLite, Power BI and DAX.

Power BI dashboard overview: insurance revenue of 187.9 billion dollars, loss ratio 64.8%, combined ratio 81.4%, a quarterly ratio trend line and combined ratio by class of business.
Overview page: direct insurance, all financial years.

NDIS Connect

Curtin University group project (five members): a web platform that helps NDIS participants compare service providers.

I led requirements specification and validation, and built the frontend components for participant requirements, provider results and budget forecasting, working from Jira tickets with feature branches in Git.

How I work

Insurance numbers get used for pricing and capital decisions, so I treat every result as something to prove.

Check against the source

Pipelines reconcile with the publisher's own totals and stop when a check fails, so errors never reach a chart.

Say what the data can't

Each finding comes with its caveats: masked values, short records, and trends that aren't statistically significant.

Use AI, verify everything

I build with Claude Code and Cursor to move faster, and validate every output against the data before it ships.

Experience and study

Operational roles where I kept records accurate, plus formal study in computing and actuarial statistics.

  • Mar 2026 – Dec 2027

    Master of Computing (Computer Science), Curtin University

    Alongside self-study for the IFoA CS1 Actuarial Statistics exam, sitting April 2027.

  • Feb 2026 – now

    Warehouse & Installations Assistant, Henri Living

    Brought large-item assembly in-house, halving delivery lead times and replacing outsourced work, with a 100% first-time completion rate.

  • Apr – Sep 2025

    Desktop Support Technician, V4 IT Services

    On-site IT support for home and business clients in Darwin, with a 100% job completion rate.

  • Apr – May 2025

    Vehicles & Parts Maintenance Coordinator, F&J Bitumen Services

    Halved turnaround on fleet and parts requests and processed 200–300 orders, with Excel reporting on stock and service schedules.

  • Oct 2021 – Dec 2024

    Bachelor of Business (Logistics and Supply Chain Management), RMIT

    Followed by Master of Data Science coursework at Charles Darwin University in 2025.

Contact

I'm looking for data analyst roles in insurance or actuarial teams in Perth or Melbourne.